The European Geosciences Union General Assembly 2019 from the MULTIPLY perspective by Gerardo Lopez-Saldana

The EGU General Assembly always is a great opportunity to both show your science and catch up with the latest scientific findings. EGU2019 was no exception. The MULTIPLY team was offered the opportunity to present various developments. I had the chance, on behalf of the Assimila and UCL-Geography teams, to present the use of MODIS and Sentinel-3 OLCI data to better characterise the land surface. What’s the result of combining MODIS and OLCI observations? The MOLCI.

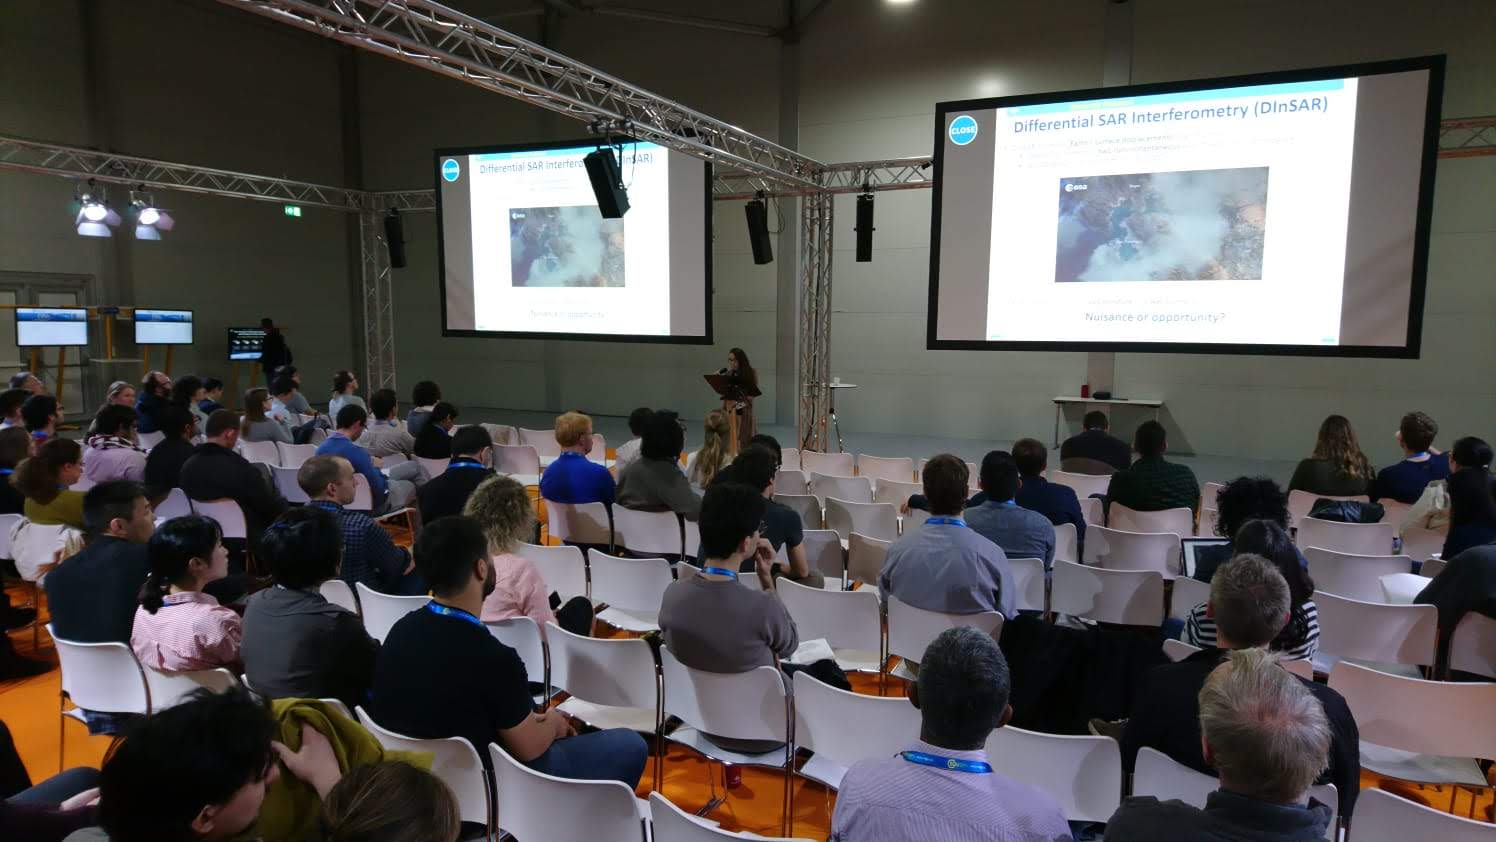
The highlight of the week for me however, was the hands-on MULTIPLY experience session. The main goal of the almost 2 hour session was to demonstrate the MULTIPLY platform and provide some theoretical background about Radiative Transfer (RT) models  such as:

  • the JRC-TIP;
  • the integration of a priori knowledge when retrieving land surface parameters, e.g. Leaf Area Index (LAI); and ultimately,
  • how to combine observations and prior information in a Bayesian scheme.

Great lecture, really well done Joris!.

The hands-on started…… and the challenges started. When you have a reasonably good processing server, performing an atmospheric correction of one Sentinel-2 MSI image using the marvellous Sensor Invariant Atmospheric Correction (SIAC) approach developed by the UCL-Geography group, everything runs smoothly. When you have 10 simultaneous processes, performance starts to slows down. This brings an interesting question, namely: you, as a user of the platform, where do you want to run your processing? Where can you do it? Would you pay for it if needed? In MULTIPLY we will address this in the near future. However this is a common issue nowadays. There are multiple cloud-computing providers with access to Earth Observation data. Perhaps the most used one being the Google Earth Engine (GEE), where you do some actual processing. Nevertheless GEE’s web code editor uses Java Script to do the processing. We don’t want to develop a RT model in Java Script. You can use its Python Application Programme Interface (API) but then the computing power will be yours, not the GEEs. Hence, the GEE is a great tool to perform some tasks but not necessarily to perform atmospheric correction of Sentinel-2 data and retrieve biophysical parameters. At least not yet.

Then, we showed some more Jupyter Notebooks. The hardcore ones we used in the platform. They brought some more interesting questions such as: “can I use my own priors?” and “could it be possible to use a different RTM?”. Basically the answer is, “yes” and “yes”. We are trying to develop the platform being as flexible as possible. In the end, if you are a scientist who knows your area of study, it doesn’t matter if it’s a micro-basin in the middle of the Amazon or a set of agricultural fields in East England. You know the characteristics of the area, you have a broad expectation of what the outputs would be. In MULTIPLY we want to take advantage of this knowledge. Hence, it’d be possible to use your RTM model of preference, create some emulators so it can run super-fast (the scientific world will always be thankful for this Jose!) and use it within the Data Assimilation MULTIPLY inference engine, KaFKA. Obviously, it won’t be that straightforward as it sounds: you might need some help of the MULTIPLY team (in exchange of food or beer) but the point is: it is possible. Right now we have three different RTMs that take different inputs, from broadband albedo to narrow band reflectance and microwave backscatter. Additionally, if you know the inputs of the RTM, you can create your own priors. In the end a prior is only the probability distribution where you can express your belief about a specific quantity before any observations are taken into account.

d21d1a89-697c-468c-9a35-09efba64952eAfter two hours of lecture and Python and plots and logfiles and questions and answers, it was clear that the MULTIPLY project is facing a great challenge and providing some solutions. But we are still short as an Earth Observation scientific community to embrace the use of multi-sensor products, rather than relying on a per-sensor product and to use uncertainties along a whole processing chain, all the way from the sensor observations to biophysical parameters. Therefore our task within MULTIPLY is to widen even more our scope to show, particularly early-career scientists that, this approach can make the most of all available observations and provide an uncertainty, a sense of how good the retrieval is. Once again EGU2019 was great but the best part was the chance to interact with scientists, looking to make a difference using Earth Observation data. And of course, the MULTIPLY Platform will be there to help them.

Behind the Platform

About thirty researchers from nine different institutes are involved in the development of the Earth Observation platform MULTIPLY. Each partner focuses on a different aspect, and combining these into one functioning platform is a challenge according to software engineer Tonio Fincke from Brockmann Consult.

“We have various parts within MULTIPLY like the different pre-processing steps, the inference engine, the prior engine, and the post-processing applications. I focus on putting all these parts together in a common platform where they can work together and are provided with the data that is needed,” Fincke explains. To achieve this, he works closely together with the partners and is available for their questions.

The developers of MULTIPLY use various forms of communication to work together on the software. In addition to email, skype and monthly telephone conferences, the software development platform GitHub is used. “On Github, we have issue trackers, project boards and there is a wiki with common rules for the developers. In the past, we also had coding workshops with different developers.”

“The challenge in bringing the different software parts together is that software can be a black box. You must give the software the correct type and form of data to let it function. It was nice that everyone was using the coding language Python, as this made it easier to integrate and construct a common code base. At the same time, it was also challenging, because there can be differences between packages that different people use, which can cause conflicts. So, we had to adapt some of the code to a common base as we wanted to avoid these conflicts,” says Fincke.

Next steps

“MULTIPLY is a very demanding project, it costs time and resources and combines many disciplines. But there is a good atmosphere within the partners which I enjoy, and we are meeting our goals,” Fincke says. He is looking forward to the next steps: “For our company, this is a very crucial phase as the Graphical User Interface is coming up.”

The next few months, Fincke will be working on improving the back-end, the code. “MULTIPLY is now available to test-users and in the background, we are still working on improving the platform, fixing bugs and integrating new features.” Fincke and his colleagues will also develop the front-end, the user interface of the platform. With this, it will be easier to configure and to define for users what they are interested in. “You should be able to use MULTIPLY without a specific background but there should also be the possibility to adjust the platform by submitting your own data, prior information or certain models.”

MULTIPLY Github

MULTIPLY launched!

From the press release as published on the Website of Leiden University.

Leiden University launches Earth Observation platform

A new online platform makes it possible to estimate the state of agricultural crops and nature area’s around the world. This enables scientists and other users to consistently combine observations of different satellites for the first time.

The platform is called MULTIPLY and was launched in November by the Institute for Environmental Sciences (CML) of Leiden University. For 8 years, researchers from CML worked together with European partners to develop the platform.

Information of multiple satellites

The platform is unique because it combines the information of multiple satellites with varying resolutions and information, instead of using only one individual satellite. This enables MULTIPLY to generate breakthrough information on vegetation and soil moisture.

This data is crucial for different applications such as mapping evapotranspiration during droughts, monitoring declining trends of biodiversity, and quantifying ecosystem services.

Oil-palm plantations

Researchers of the CML have used the platform to quantify the impact of oil-palm plantations in Northern Borneo on biodiversity for the first time using earth observation data. The high resolution of the platform data enabled them to distinguish between the different land uses. The study confirmed a significantly lower biodiversity for the Northern Borneo oil palm plantations, indicating higher risks to ecosystem services.

Currently, the MULTIPLY platform has only been made available to scientists for the purpose of testing it on their own research. During this trial-period, these scientists can explore the benefits of the novel approach, but also provide feedback on how well the earth observation information matches ground measurements. Next to these studies, MULTIPLY will further expanded to even more satellites. Afterwards, the platform will be delivered to the European committee which will allow this service to be available to the general public.

Toulouse_France

City of Toulouse in Southern France with surrounding agricultural fields. Captured on 10 July 2017 by Sentinel-2 and processed by ESA.

Discovery lecture

MULTIPLY: Combining Satellite Observations in order to investigate biodiversity patterns

In view of the launch of the MULTIPLY platform Dr. Joris Timmermans introduced the platform to students and staff of the Faculty of Science at Leiden University. He explained the limitations of current remote sensing practices, the aim of MULTIPLY, the specific design choices and results. 

Human society increasingly relies on information derived from Earth Observation data. In particular, there is a growing demand for information on land surface variables. To facilitate these demands, the number of satellites and small cube-sat constellations are projected to increase dramatically over the next years. This increase provides enormous challenges to retrieve consistent high-quality information from this big data. Current approaches entail creating individual land surface products for each satellite mission. As such, the majority of available products are created using single-sensor approaches. This production-heterogeneity severely limits the advancement of research fields due to inconsistencies in comparing land surface estimates.

An additional challenge is that land surface parameter retrieval suffers from ill-posedness: the fact that there are fewer observables than the number of desired parameters (required for accurate retrieval). By only considering observations from singular satellites, this ill-posedness is worsened especially considering the various spectral-sensitivities of different land surface parameters. A multi-sensor approach capable of integrating such sensitivities, by accurately modeling the physical radiative processes, resolves these limitations. Furthermore, such a multi-sensor approach also allows benefiting from synergies of using multi-scale/heterogeneous observation types/varying temporal frequencies of different sensors.

Based on these concepts, the MULTIscale SENTINEL land surface information retrieval PLatform (H2020 MULTIPLY) was created to obtain the best possible estimate of the land surface state, taking into account the different characteristics of different sensors and data streams. The MULTIPLY platform builds upon the original ideas implemented in the EOLDAS system but has major advances on operationalization, enhanced consistency (across sensor types), higher computational efficiency and improved gap-filling. Specifically, with the MULTIPLY platform, it has become possible to

  1. Apply generic atmospheric pre-processing algorithms;
  2. Derive estimates of land surface variables that are gap-free;
  3. Combine data from multiple satellite constellations within one internally consistent retrieval based on radiative transfer models;
  4. Combine data from SAR observations with optical remote sensing data using compatible radiative transfer models;
  5. Derive a set of internally consistent data products that couple different (coarse and high) resolutions.

The prototype of the MULTIPLY has been implemented as a cloud service and is currently being tested by researchers.

discoverylecture

Night of Arts & Science

Team members from Leiden University participated in the “Night of Arts & Science”, on the 16th of September in Leiden. Together with other staff members from the CML, Joris Timmermans, Leon Hauser, and Amie Corbin created “Viewing Beyond”. Using remote sensing technology in several interactive exhibits, they opened the visitors their eyes and let them view beyond the capabilities of the human eye.

Team member Esther Philips: ‘Considering that for most people remote sensing is probably quite unknown, we agreed that it would be really interesting to bring this emerging technology to the masses.’

Using cardboard VR glasses, people could experience how animals see the world. With their left eye, they saw as a human and with their right eye as another animal species, like a bee, a shark, or an eagle. The visitors explored a world that is usually hidden from human eyes.21587253_1489282267822441_7866941079516472688_o

With a living experiment, visitors observed how remote sensing technology works. Using spectrometers, the reflected light from different types of plants was measured and broadcasted live on a screen. The visitors learned how different plants and different conditions, like varying moisture content or a nitrogen deficiency, yield different outputs.

To discover the various possibilities of remote sensing research, some examples were shown in a slideshow on a screen. For example, how thermal imagery was used to map hurricane Irma and night observations are used to monitor the world light pollution. This last subject was further explained in the final part of the experience.

To make people aware of light pollution, people could see the light pollution on a special nighttime globe. Also, visitors could ‘join the dark side’ and contribute to citizen science projects on light pollution. One of these was created for the festival. Visitors could download a lux meter app and search for the darkest spot in the botanical gardens. By handing in their data they could win a price.

NKK 4

With Viewing Beyond visitors viewed the world beyond their eyes and shared and discussed their experiences and views on research with scientists. This expanded the knowledge of both the visitors as the participating scientists, hopefully leading to a brighter future with darker nights.

In the news: https://www.universiteitleiden.nl/en/news/2017/09/traveling-into-space-and-back-again